
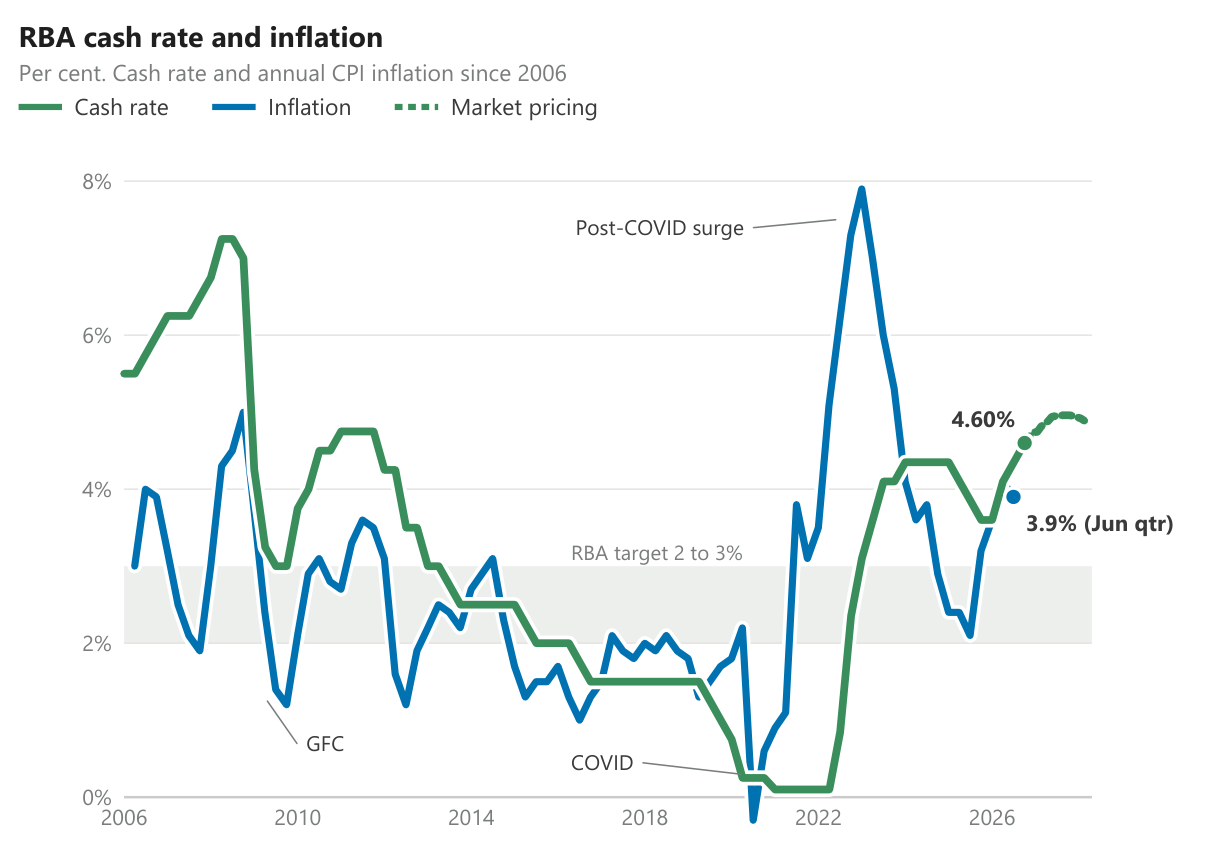
The RBA lifted the cash rate to 4.60% on 29 September, and a day later the ABS reported inflation of 4.0% for the year to August. You'll have heard it blamed on the war. The official numbers say the war is only part of it: most of the rise is home-grown.
We've put the case together from ABS, RBA, Treasury and Parliamentary Budget Office figures rather than from anyone's talking points. It's mostly tables, because the numbers speak for themselves.
| The numbers | Now |
|---|---|
| Inflation, year to August | 4.0% |
| Underlying inflation (RBA target is 2 to 3%) | 3.6% |
| RBA cash rate, after 4 rises this year | 4.60% |
| Federal spending, highest since 1986-87 outside COVID | 26.9% of GDP |
What's in your control, and what isn't
| Where the 4.0% came from | Share | In your control? |
|---|---|---|
| Set, regulated or largely funded by governments (power, water, rates, rego, health, school fees, child care, public transport) | 28% | No |
| World oil prices (petrol and diesel) | 11% | Very little |
| Other essentials priced in the market (rent, new homes, groceries, insurance) | 31% | Hard to avoid |
| Tobacco (excise set by government) | 5% | Yes |
| Other discretionary spending (eating out, holidays, recreation, alcohol, clothing, furniture) | 25% | Yes |
| Total | 100% |
| Must-haves versus nice-to-haves | Rise | Share of the rise |
|---|---|---|
| Must-haves (housing, power, fuel, groceries, health, education, insurance) | 4.7% | 69% |
| Nice-to-haves (eating out, holidays, recreation, alcohol, tobacco, clothing) | 3.0% | 31% |
About 69% of the rise is in things most households can't easily cut back on, which is why it feels worse than the headline figure.
Most of it is home-grown
| August 2026 | Rise over the year |
|---|---|
| Prices set in Australia (rents, services, government charges) | 4.5% |
| Prices set on world markets (fuel, cars, electronics, some food) | 2.9% |
| War's effect on underlying inflation, June quarter (RBA) | 0.1 of the 0.8 points |
The war explains much of the recent jump in fuel, but inflation was already rising, and the RBA started raising rates in February, before the conflict began.
The accelerator and the brake
| What it does | Who controls it | |
|---|---|---|
| Fiscal policy (the accelerator) | Government spending and tax. A record 28.9% of GDP is now government demand. | Federal and state governments |
| Monetary policy (the brake) | The cash rate. Now 4.60%, after 4 rises this year. | The Reserve Bank |
The RBA has one main tool. When governments keep their foot on the accelerator, the RBA has to brake harder, and borrowers pay: about $454 a month more than at the start of the year on a $750,000 loan (Canstar). To be fair, private spending grew faster last year (3.5% against 2.2% for government demand).
Government spending and debt
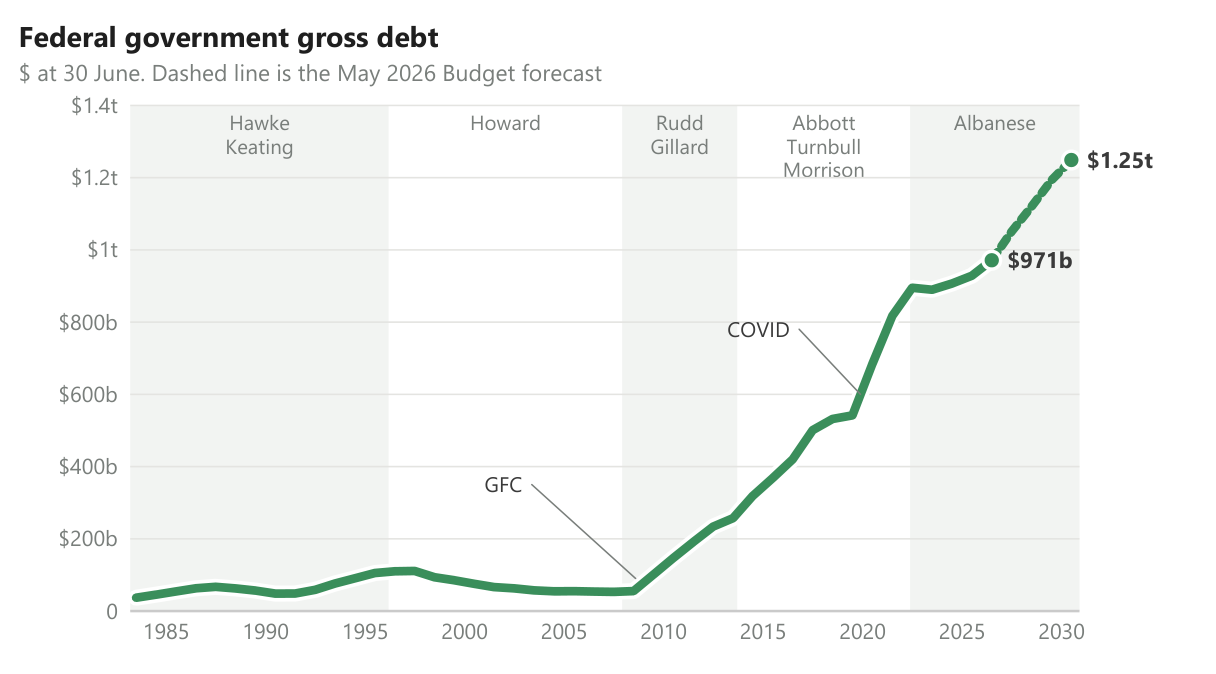
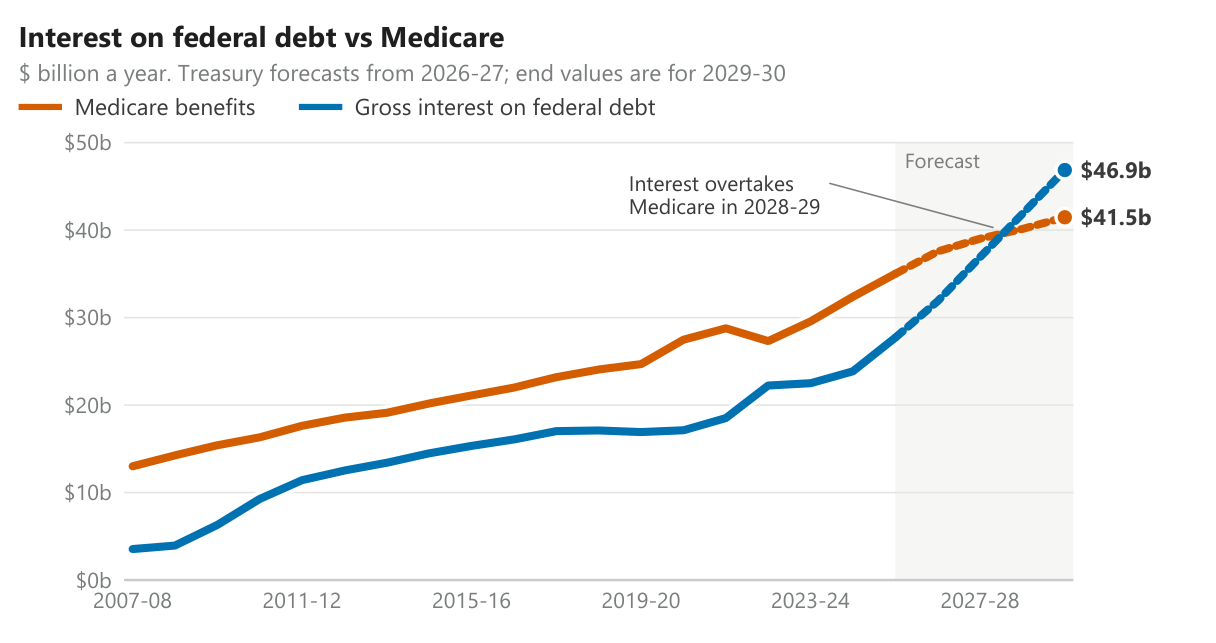
Federal tax is at its highest share of GDP since 2005-06 (24.1%), yet the budget is $22.3 billion in deficit. Gross debt is $971 billion and forecast to reach $1.25 trillion by 2030, and the interest bill is forecast to overtake Medicare in 2028-29.
Government-funded hiring
| The hiring numbers | Figure |
|---|---|
| Share of new jobs from health, education and public administration (mostly government-funded), year to June 2024 | 80% |
| Their share of all jobs, 2019 to 2026 | 26% rising to 29.5% |
| Public versus private sector job growth, June 2022 to June 2025 | +9.8% against +6.6% |
| NDIS costs, 2025-26 | +10.5% to $51.2 billion |
The RBA found this hiring likely tightened the job market for private employers. It eased in the year to June 2026, when these sectors supplied 28% of new jobs.
Productivity, and what would fix it
| Productivity | |
|---|---|
| What it is | How much we produce for each hour worked |
| Why it matters | When it rises, wages can rise without prices rising |
| Where we are | Down 0.2% over the past year, and barely moved in a decade |
| What it is worth | At least $14,000 a year for the average full-time worker by 2035 |
| The fix | Who's calling for it |
|---|---|
| Governments ease off: restrain spending, cut the deficit | OECD, CBA, Philip Lowe |
| Target cost-of-living help instead of paying everyone | EY, CBA |
| Build more homes and energy: easier zoning, faster approvals, more grid | OECD, Productivity Commission |
| Tax reform, less red tape, more competition | Productivity Commission, OECD |
The bottom line
Inflation is being pushed up by both private spending, including the AI and data-centre boom, and by record government spending and hiring. Much of what's driving it sits outside a household's control. The part that isn't - your own spending, your loan structure, how your savings are invested - is where good planning makes the difference.
The full Client Update, with every table and chart, is available as a PDF. If you want to talk through what it means for your loan, savings or retirement income, book a complimentary chat.
Sources: ABS, RBA, Treasury, Parliamentary Budget Office, APSC, NDIA, ASX, OECD, Productivity Commission and Canstar, as at 30 September 2026. Views of named economists are from their public statements. This article contains general information only. It does not take into account your objectives, financial situation or needs, and you should consider whether it is appropriate for you before acting on it.